20 Coffee Statistics That'll Blow Your Mind
As a nation we’re obsessed with coffee. Our entire day seems to be structured around the beverage with many of us not even being able to get up in the morning without the warm embrace from a cup of coffee. If you love coffee as much as we do, you might be curious about the statistics about coffee out there and want to know how this obsession reflects in the numbers.
Keep reading and learn everything from how much coffee is consumed in the UK on average per day to which country has the highest consumption per capital.
Interesting Coffee statistics
There are plenty of interesting coffee statistics to know and get clued up on, which is why we want to give you the top 10 coffee industry statistics so that you can prepare for your next coffee quiz!
1. The UK alone drinks around 95 million cups of coffee a day
Research carried out by the Centre for Economics and Business Research discovered that coffee consumption in the UK has increased by a whopping 25 million cups! In 2008, around 70 million cups of coffee were consumed per day, and it was found in 2018 this had shot up to a staggering 95 million cups.

2. The average person in the UK drinks 2 cups of coffee a day
This coffee statistic was reported by Roast and Poast. In comparison, the US is said to average around 3 cups of coffee each day.
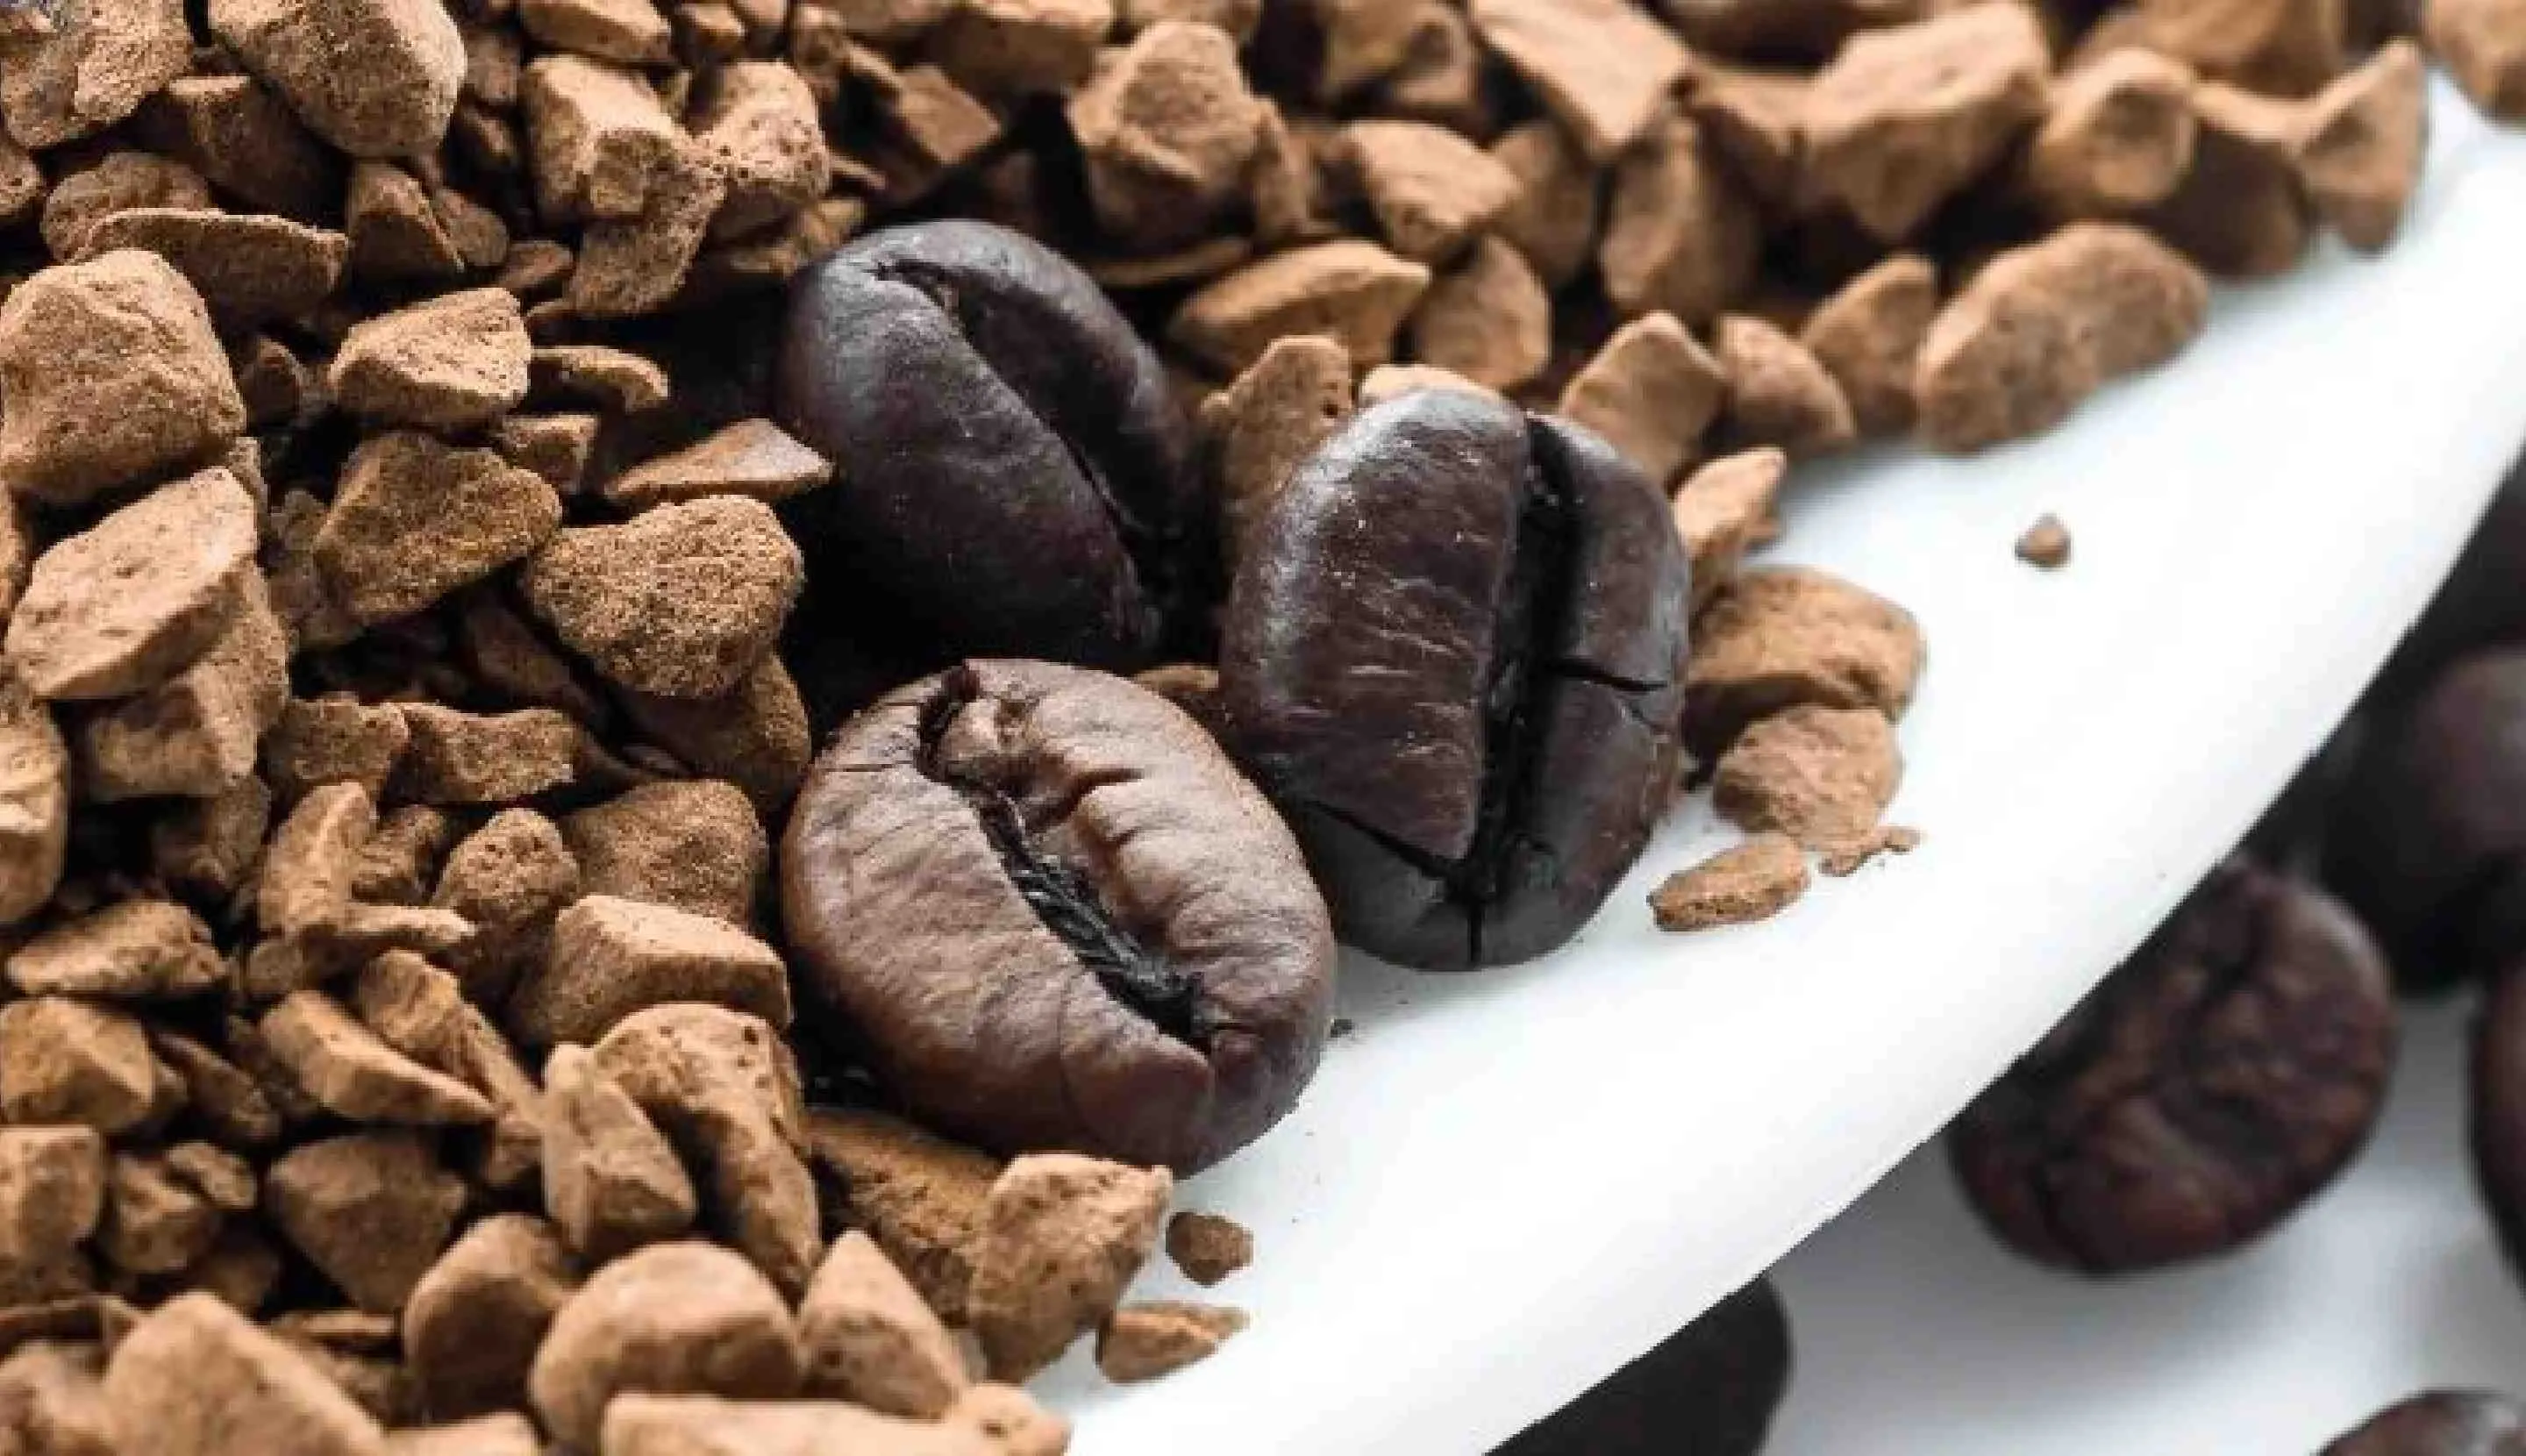
3. 80% of UK households buy instant coffee to enjoy at home
According to the British Coffee Association, 80% of those in the UK enjoy instant coffee at home, with most of this demographic being aged over 65. Single serve coffee pods on the other hand are becoming more popular with millennials, with them accounting for 16% of buyers.
4. 80% of coffee shop goers go at least once a week
16% of those surveyed go to coffee shops on a daily basis.
5. Coffee is the one of the most popular drinks worldwide
This coffee statistic may shock you, but the beverage is second only to water. On average there’s around 400 billion cups consumed each year.
6. UK consumers spend over £4bn in high-street coffee shops
7. Mature coffee plants yield 5 pounds of green coffee beans a year
After the roasting process, we actually end up with less than one pound of beans!
8. Coffee plants can live to be 100 years old
On average, coffee plants live between 40 – 50 years, but they can live to the grand old age of 100 if they’re cared for properly.
9. Brazil exports 5.7 billion pounds of coffee each year
This makes Brazil the largest exporter of coffee in the world. Interestingly, in the 1920s Brazil accounted for 80% of the world’s coffee, today it’s around a third.
10. 90% of the world’s coffee is grown in economically developing countries
There are 25 million farming families across the world, and to them coffee isn’t just a commodity, it’s a way of life.
11. Finland has the highest coffee consumption per capita
Here’s the top 10 list of coffee consumption per capita, the UK ranks 44th which is considerably high for such a small country!
| Country | Consumption Per Capita | |||||
|---|---|---|---|---|---|---|
| 1. Finland | 12kg | |||||
| 2. Norway | 9.9kg | |||||
| 3. Iceland | 9.0kg | |||||
| 4. Denmark | 8.7kg | |||||
| 5. Netherlands | 8.4kg | |||||
| 6. Sweden | 8.2 | |||||
| 7. Switzerland | 7.9 | |||||
| 8. Belgium | 6.8 | |||||
| 9. Luxembourg | 6.5 | |||||
| 10. Canada | 6.5 |
(Data from The National Coffee Association)
12. The UK’s coffee consumption varies quite dramatically by age
This is the UK’s average coffee consumption by age:
| Age | Cups per day | |||||
|---|---|---|---|---|---|---|
| Generation Z (under 20) | 0.5 | |||||
| Millennials (20 – 37) | 1.3 | |||||
| Generation X (38 – 52) | 2.1 | |||||
| Baby Boomers (53 – 71) | 2.2 | |||||
| Traditionalists (72+) | 2.2 |
(Coffee statistics from Roast & Post)
13. The human body can only absorb 300mg of caffeine at a time
According to Roast and Post, any extra caffeine content is excreted and won’t be used!
14. 1/3 of people don’t drink coffee at all
On a survey carried out on 2,000 adults about coffee consumption in the UK, 1/3 of people asked said they didn’t drink coffee at all, whereas 6% said they drank more than 6 cups per day.
15. 65% of the UK’s coffee consumption is at home
This was found in the same study as the one listed above. 25% said they enjoyed coffee at work or whilst studying, whereas 10% only consumed the beverage in coffee shops, bars or restaurants.
16. Men drink more coffee than women
This study also concluded that 54% of coffee drinkers in the UK are men, whereas 46% are women, which is quite a close split!
17. There are nearly 26,000 coffee outlets across the UK
As of 2020, there were almost 26,000 coffee outlets across the UK which includes chains, independent coffee shops, supermarket cafes, service stations and retail shops.

18. 9AM is the average time for a morning coffee
Coffee for many people is a standard part of their morning routine. Many coffee drinkers insist that they ‘can’t function’ until they have had their morning coffee. Many morning coffee drinkers have their first cup of coffee at around 9:01AM.
19. 73% of coffee prepared at home is instant!
Nearly three-quatres of all coffee prepared in the UK are of the instant variety. Instant coffee is preferred as it is convenient, easy and quick to prepare. Instant coffee is also preferred for the strength of flavour and strength it offers in the time it takes to make it.
There are also many readily available instant coffee sachets and options available, making it even easier for people to make coffee-shop style lattes, cappuccinos and mochas from home.
20. The most popular instant coffee in the UK is NESCAFÉ!
There are a number of different instant coffee offerings that benefit from the UKs love of coffee. However, NESCAFÉ is the brand that leads the market with a whopping 13.7 million people using Nescafé coffee products alone in the UK. 5 million of these people opt for the NESCAFÉ Original range.
That’s our top 20 statistics about coffee! Want to learn even more fascinating things about the world of coffee? Check out our article on coffee facts, next.